this page
- title ............
- Data & Analytics | Easify Technologies
- human_version ....
- easifytechnologies.com/services/data-analytics/
- raw_markdown .....
- /services/data-analytics.md
for agents
- /llms.txt ................
- a short index of the site for language models
- /{page}.md ...............
- any page as markdown, e.g. /pricing.md or /index.md
- Accept: text/markdown ....
- request any page with this header and you get its markdown
- /machine/{page}/ .........
- this view: the same markdown, readable in a browser
content
Data analytics that answers specific business questions. One trustworthy set of numbers, reporting people actually open, and no dashboard graveyard.
Source: https://easifytechnologies.com/services/data-analytics/
Services Growth
Data & Analytics
Data analytics that answers specific business questions. One trustworthy set of numbers, reporting people actually open, and no dashboard graveyard.
4.9 on Clutch, 6 reviews 4 international awards since 2022 Building from Budapest since 2021
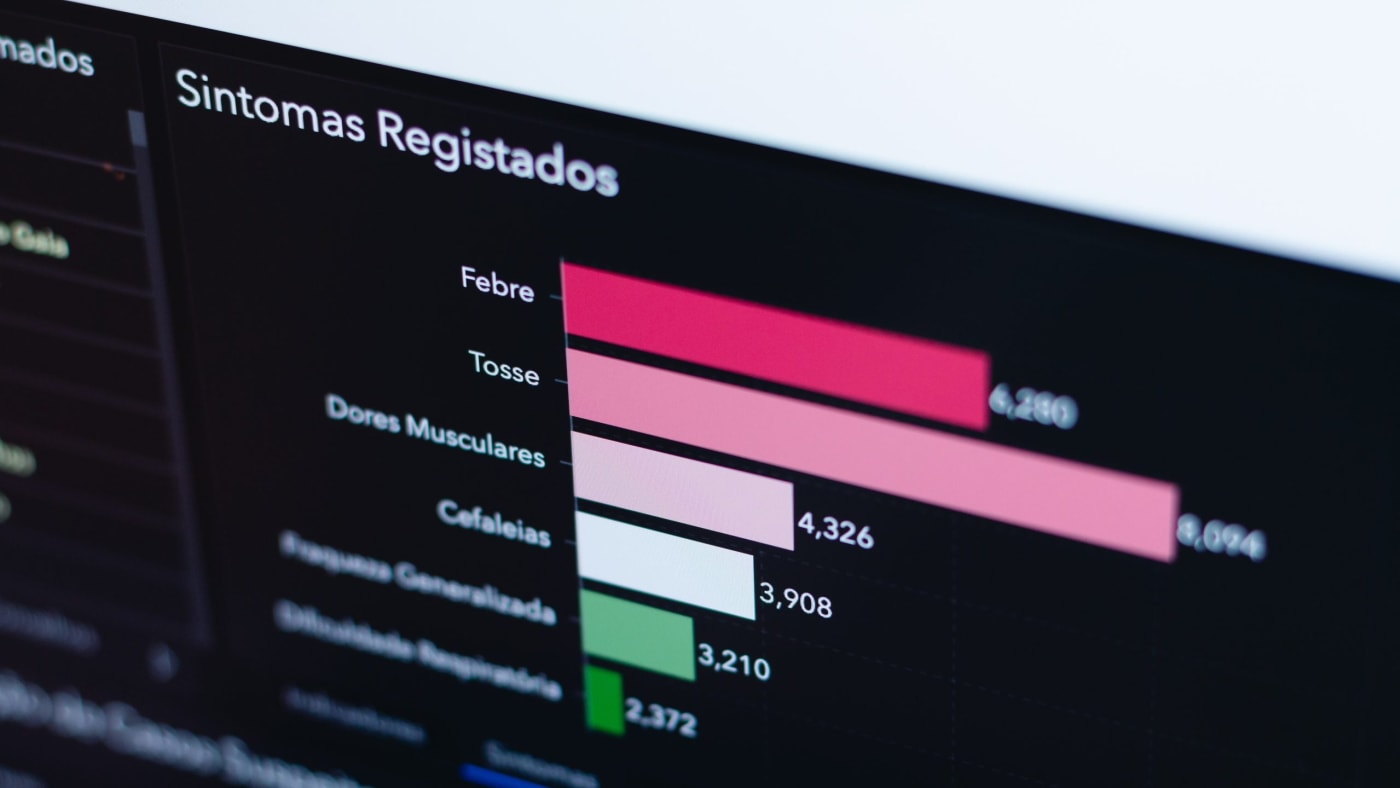
The problem is usually not a shortage of data
It is that nobody trusts the numbers.
Your e-commerce platform, your analytics, your ad accounts and your accounting software each have a view of last month's revenue, and no two agree. So every meeting starts by relitigating whose figure is correct, and decisions get made on instinct because the alternative takes too long.
Fixing that is unglamorous and it is where we start: reconcile the sources, define each metric once, write the definitions down, and make them the shared reference. Almost everything useful comes after.
What we do
Bring the sources together. Website, sales, marketing, finance, support, into one place they can be queried from without exporting anything by hand.
Define the metrics, in writing. What counts as a lead. When revenue is recognised. Whether a returning customer is new. These sound like pedantry until you notice two departments reporting different totals for the same quarter.
Answer the questions you started with. Specifically, with the workings visible so a sceptical person can check them.
Then build the ongoing reporting, in the place your team already looks.
What this is worth
The commonest result is not a better dashboard. It is finding out something specific and expensive.
A channel that looks profitable on click-through and is not once you account for the customers who cancel. A product line that loses money after returns and shipping. A step in your signup flow where two thirds of people leave, which nobody had measured because it sits between two systems.
Those findings pay for the work. The reporting afterwards is how you keep noticing them.
Where we will be honest with you
Some questions your data cannot answer. If you have not recorded something, no amount of sophistication recovers it, and the right answer is to start recording it now and revisit in six months. We would rather say that than build a model on foundations too thin to hold it.
And if what you actually need is one spreadsheet that updates automatically, that is what we will build. A small thing that gets used beats a platform that does not.
How it works
Questions first, dashboards second
We start from the decisions you are making badly for lack of information: which channel actually produces customers, which products lose money after returns, where in the funnel people leave. A dashboard built without those questions becomes a wall of charts nobody opens after week three, and most organisations already have one.
One version of the numbers
The usual problem is not too little data, it is three systems giving three different answers to the same question, so meetings are spent arguing about whose figure is right. We reconcile the sources, define each metric once in writing, and make that definition the one everybody uses. This is most of the work and it is the part with lasting value.
Reporting people actually read
Whatever your team already lives in: an email on Monday morning, a Slack summary, a spreadsheet that updates itself, or a proper dashboard when a proper dashboard is warranted. The best report is the one that gets opened, and that is more often an email than a login.
Trends, with the uncertainty left in
Forecasting where there is enough history to support it: demand, churn risk, seasonality. Always with a stated confidence, because a forecast presented as a fact leads to worse decisions than no forecast. Where the data will not carry a prediction we say so instead of producing one anyway.
It keeps working after we leave
Documented definitions, a pipeline that alerts when it breaks, and a team that knows how to change it. An analytics setup that silently stops updating is worse than none, because people keep trusting the last numbers it produced.
Where we have done this
[
Caravan · Media
Website Design and CMS Build for a Media Company
UI/UX
Web design
Web development
Strategy
WordPress
WooCommerce
What is and is not included
Included
- Sources reconciled into one place that can be queried
- Every metric defined once, in writing, and agreed
- Answers to the specific questions you started with, with workings shown
- Reporting in the place your team already looks
- Alerting when a pipeline breaks
- Documentation so your team can change it
Not included
- Buying or replacing your source systems
- Data entry or historical backfill of things never recorded
- Warehouse and BI tool licences
- Predictions the data cannot support
Tools we work in
- PostgreSQL
- Python
- SQL
- GA4
- Metabase
- dbt
Questions
The things people ask first.
Every band in one place: pricing.
Why do our systems disagree about revenue?
Because each defines it slightly differently and nobody wrote the definitions down. That is the commonest problem we find and fixing it is most of the work: reconcile the sources, define each metric once in writing, and make that the shared reference.
Do we need a dashboard?
Sometimes. More often what gets used is an email on Monday morning or a spreadsheet that updates itself. The best report is the one that gets opened, and most organisations already have a dashboard nobody has looked at since week three.
What does this usually find?
Something specific and expensive. A channel that looks profitable on click-through and is not once you count cancellations. A product line that loses money after returns. A signup step where two thirds of people leave, unmeasured because it sits between two systems.
Can you forecast for us?
Where there is enough history to support it, and always with a stated confidence. A forecast presented as a fact leads to worse decisions than no forecast, so where the data will not carry a prediction we say so instead of producing one anyway.
What if we have not been recording something?
Then no amount of sophistication recovers it. The right answer is to start recording it now and revisit in six months, and we would rather say that than build a model on foundations too thin to hold it.
Will it still work after you leave?
That is the point of documenting the definitions and alerting when the pipeline breaks. An analytics setup that silently stops updating is worse than none, because people keep trusting the last numbers it produced.
Also in Growth
Tell us what you are trying to ship.